Features
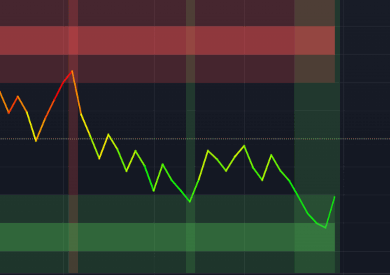
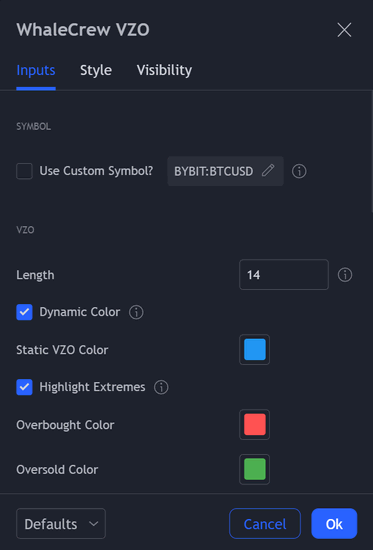
Dynamic Colors
Dynamic coloring makes the VZO easy to understand.
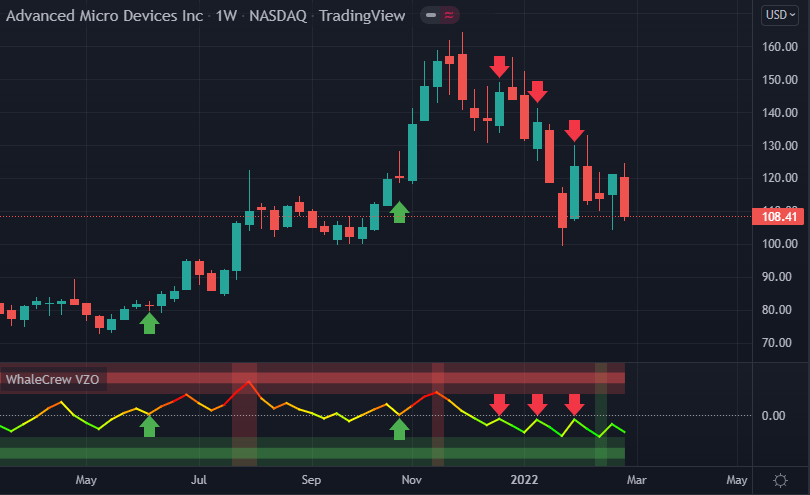
Highlight Extremes
Highlights overbought and oversold situations.
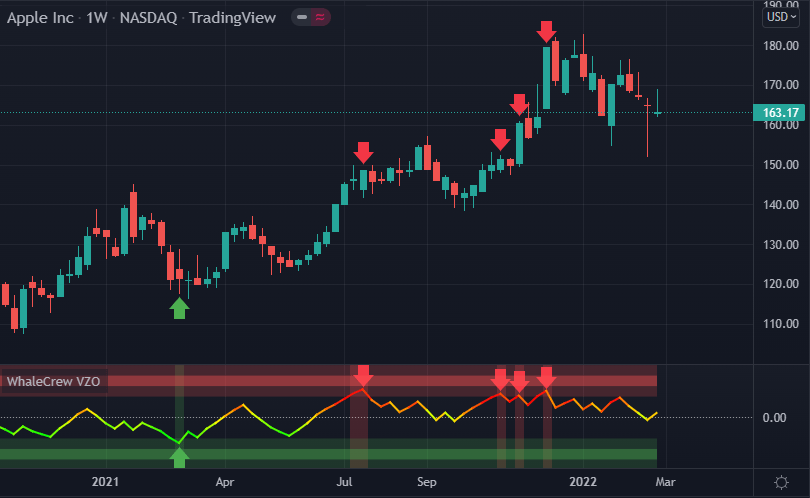
Reversal Risk Arrows
Plots an arrow whenever the VZO is at risk of reversing.
Divergence Detection
Automatically detects regular and hidden divergences.
Threshold System
Get alerted whenever the VZO is spending an overextended time above or below a threshold.
Examples
Watch out for extremes
Be cautious whenever the VZO is oscillating within the overbought or oversold range, a reversal could be imminent.
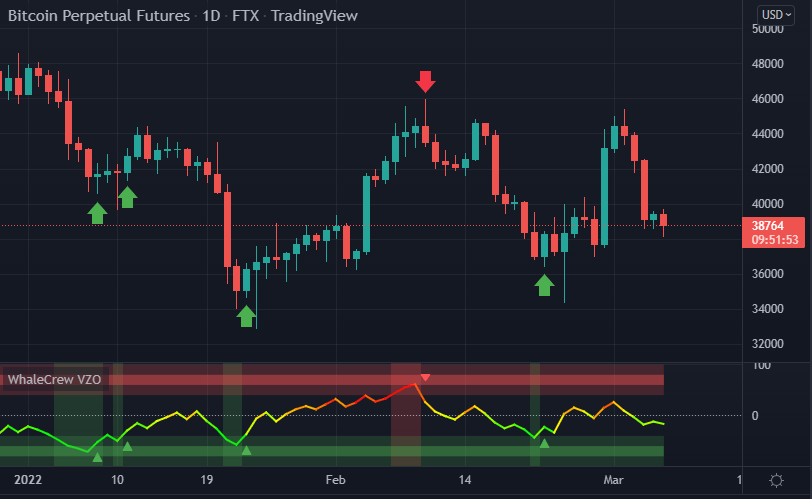
Keep an eye on the zero line
The zero line often acts as support or resistance. Some traders like to trade based of the VZO crossing the zero line.
Pay attention to Reversal Risk Arrows
Whenever the VZO is overbought or oversold and at risk of reversing a small arrow will appear.
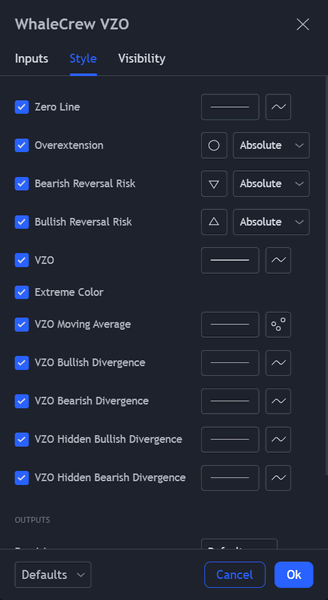
MAKE IT YOUR OWN
You can configure and style VZO to your liking. Apply different shapes and colors to make it unique!
EXCELLENT DOCUMENTATION
Our detailed documentation will help you gain in-depth knowledge to truly master your tools!